Interview with Scott Tulk: A New Data Portal for the City of Kingston

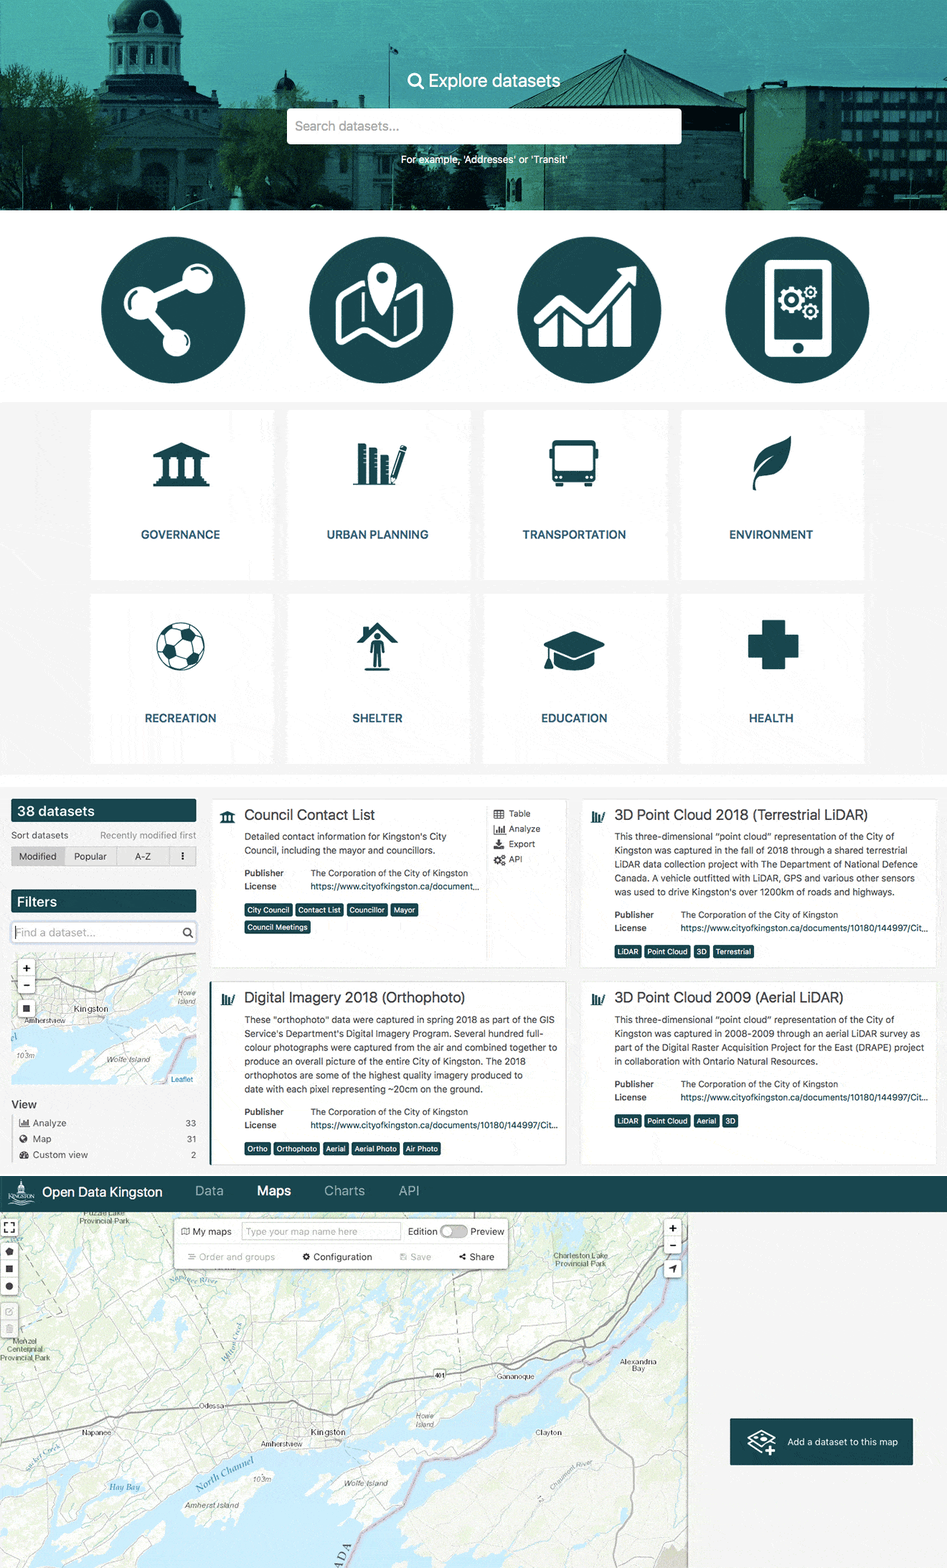
Earlier this year the City of Kingston (Canada) launched a new data portal and we organized an interview with Scott Tulk, Technology Solutions Architect in Information Systems and Technology, to learn more about this local data initiative.
Earlier this year the City of Kingston (Canada) launched a new data portal and we organized an interview with Scott Tulk, Technology Solutions Architect in Information Systems and Technology, to learn more about this local data initiative.
Congratulations on the launch of this new data portal! How did the launch go?
Thank you very much! Early in 2018, the Open Data Kingston team had the great pleasure of announcing the launch of Open Data Kingston at the Eastern Ontario Municipal Data Roundtable here in Kingston. The roundtable was a partnership by the World Council on City Data (WCCD) and the City of Kingston. It was the perfect venue to speak about our program and officially announce its launch. The feedback we’ve received since the event has been very positive. We recognize there’s much more to be done to ensure we have a high quality and relevant experience for residents and innovators in the Eastern Ontario region, but so far so good.
This is not your first open data initiative. What lessons did the City of Kingston learn from its past open data program?
At the roundtable, Jess Rogers, our technical data lead, and I also had the opportunity to speak about a few of the lessons we’ve learned over the years.
Perhaps the main lesson is to never lose sight of why you’re doing what you’re doing. This is so fundamental and yet often overlooked. Many difficult decisions are made easier by reviewing the goals and objectives of an initiative. For example, the transparency of government is a very important priority these days and, at the local level, this has manifested itself in a clear Open Government mandate from our city council. In other words, we have been directed to be open by default as an organization. We must respect privacy and be mindful of data ownership issues, but the commitment to be open is there at the highest levels. But simply publishing raw data for an audience that may not have the tools or technology to explore or analyze it, may not be that transparent in the end. It just isn’t good enough by today’s standards.
“Is this truly transparent?” was one of the core questions we asked ourselves throughout the process. It led us to look for solutions that not only let us publish data, but also remove as many barriers to insights for people as possible. For us, this meant finding a solution that provides tools for exploring and interacting with our data using nothing more than a browser.
We’ve also found that language can be a barrier too, so we are working to remove jargon from the metadata while still providing the technical details that more seasoned data analysts require.
A final lesson worth mentioning is that it’s never too early to engage data owners about the virtues of open data. There is a natural lag time between hearing about open data for the first time and fully appreciating the benefits to the organization and the public. All of us need time to reflect and get over the natural anxiety and fear that may come with any change and open data can be a big shift for some. Doing that engagement early ensures there is time for reflection.
How did you lead this initiative internally and who was involved with this project?
Like many municipal IT departments, we are supporting multiple large and complex digital transformation projects, so it was expected our open data team would remain small and staffed with part-timers. We have a core two-person team consisting of a systems analyst/data lead (Jess) and a program manager/architect (myself). There is also a much larger extended team of specialists to draw upon. The Communications and Customer Experience department is instrumental in helping us establish an engagement plan with local open data and citizen communities. We also rely on various communications specialists to provide design options that are consistent with the overall look and feel of other City-owned websites and meet accessibility requirements.
We are also lucky to have a very skilled team of GIS, web and systems developers that can deliver solutions quickly and effectively. As we focus on broadening our data to include more non-GIS datasets, such as elections results, project status and financial data, we’ve had to broaden the virtual team out as well.
It may be cliché but this is a team effort.
Could you share examples of civic issues that you are trying to solve with this open data initiative?
This is an interesting question. Our open data platform is a tool anyone who might be looking to solve civic problems can use. Potentially, open data can be used for any such issue, but we are not designing the platform around specific concerns right now. That said, one particularly relevant example is the Mayor’s Innovation Challenge. This is a contest where post-secondary student teams propose ways to help solve local issues and vie for some impressive prizes. Teams are presented with problems the City wishes to tackle and develop innovative solutions, some of which will rely on technology and data.
Another example is the City’s application to the Government of Canada’s Smart Cities Challenge, submitted in partnership with Utilities Kingston, Queen’s University, St. Lawrence College and community organizations. Our Smart Kingston proposal outlines solutions that address issues of isolation in our aging population. Using data from many sources, including potentially Open Data Kingston, the team hopes to address social, digital and physical disconnectedness among vulnerable members of this group and improve well-being.
As we release more open data on the portal there will be many more opportunities to improve life for area residents and businesses and even promote data-sharing between internal City departments. It is exciting to be part of it.
 Copy to clipboard
How do you expect this data portal will help you engage with your community?
Open Data Kingston will play a supporting role in our broader community engagement efforts. In 2017 the City launched a community engagement platform and we are proactively using that tool to reach out to a wider audience than ever before. This year the City will be launching a Customer Relationship Management (CRM) platform. The CRM will be the main tool used by residents to seek help, ask questions and report issues in the community. This will drive public engagement to new levels at the City and improve many aspects of our service delivery.
What’s exciting is that the CRM will generate lots of useful data and we plan to publish that data on the open data portal after the CRM public launch. We really believe this data will be some of the most useful we offer, especially when combined with some of our other datasets. It represents an amazing opportunity for app developers and others to explore. It is not hard to imagine how the CRM, community engagement platform and open data will work together to foster a more informed community and help the City meet the changing needs and expectations of the public.
Do you have specific programs or ideas to encourage data usage beyond City staff and especially among students, scientists, the community or policymakers? Any data visualization projects, for example?
Once we have some key datasets on the portal, such as financial, service-request and election-result data, we will be engaging in a focused campaign to promote our data services and APIs to the local app-development community and learning institutions. We believe having a variety of relevant, high-quality datasets will drive those uses. We also believe our most important skill is simply listening. As mentioned earlier our Communications and Customer Experience department is helping us develop a public engagement plan that will create that critical dialogue about what is working well and what isn’t. Hearing what is important to the community and being able to respond is perhaps the biggest challenge for us moving forward.
What criteria are you using to gauge the success of this data initiative?
We are taking a long-term approach with open data. We see this platform as a core piece of both the innovation and transparency pictures in our region over an extended period of time. So, we are primarily concerned with the quality and relevance of the data and datasets we provide and not the quantity. That said, we have increased datasets from 22 at launch to over 35 today. Perhaps the most fundamental gauge of success is simply the level of activity. How many people visit Open Data Kingston? Is the audience shrinking, static or growing? This is a basic measure of the health and relevance of the platform. ODS has some very useful analytic tools which, in combination with Google analytics, will help us assess this very basic measure over time.
More importantly, measures will be assessed through public engagement and outreach. Is the data trustworthy? Do we have valuable datasets in general? What is missing? Is the data leading to meaningful insights and better outcomes? We think these measures are best assessed through dialogue with, listening to and responding to the public. This is a major focus of our planning as we develop our roadmap of data delivery.
Congratulations again on the launch of this new data portal. We are looking forward to following all the new ideas and initiatives you will implement to continue engaging with your community.

Data contracts are key to building trust in data in distributed environments, and are at the heart of data products. We look at how to build and enforce data contracts through a data product marketplace to unlock greater value from data.

It can be hard to understand exactly what a data product is, given the many ways that the term is defined and applied. To provide clarity this article provides a business-focused definition of a data product, centered on how it makes data accessible and usable by the wider organization, while creating long-term business value.

