Democratizing data to make cities youthful and better for all
How can you use data to make people’s lives better? To find out, we interviewed Canadian social enterprise Youthful Cities to learn how it is empowering young people with a combination of relevant data and the tools they need to understand and take action based on this information.

Data has the ability to transform society and empower everyone to collaborate and find solutions to today’s pressing problems. That’s why data democratization is vital, going beyond simple information sharing to ensure it is engaging, understandable and can drive change.
That’s the mission of Youthful Cities, a Canadian social enterprise that creates data-driven solutions to make cities better for everyone. It has a unique approach – bringing together young people aged between 15 and 29 to collect data, spark dialogue, generate insights, and then work towards positive action.
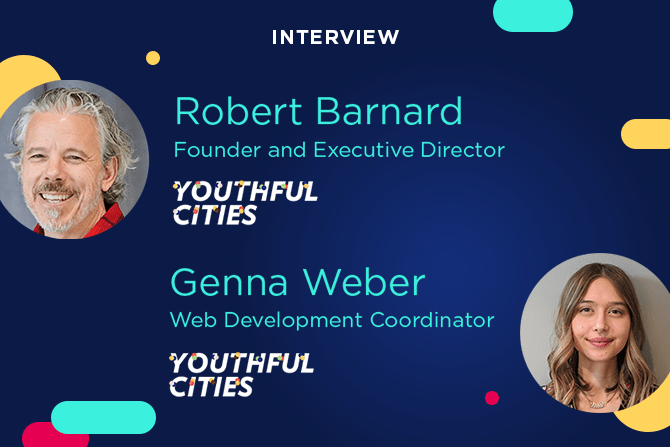
Youthful Cities relies on Opendatasoft’s all-in-one platform across its operations. We interviewed founder and Executive Director Robert Barnard and Web Development Coordinator Genna Weber about their work, the importance of data democratization, and lessons for the wider community.
How did the Youthful Cities project come about?
Robert Barnard: It started with a simple question: Which is the best city in the world for young people? To get the answer we knew we needed to gather and share good data, rather than relying on opinions. That led us to create our Indexes, which are based on indicators set by young people. In 2013 we surveyed 55 cities and this year, a decade later, we hope to survey 100 around the world.
Since our first research we’ve expanded in multiple ways, such as creating our Urban Work Index. Data has always been at the heart of what we do. We want to give young people access to data that helps them support their passions and create solutions that are focused on solving the right problems. Youthful cities are not just about young people. They are more connected, more open, more dynamic, more inventive, more curious, and more playful places. Places like that benefit us all.
How are you sharing data and ensuring it is used effectively?
Genna Weber: Data sharing is about much more than publishing a report, particularly on complex subjects such as cities. We wanted to enable people to get more out of the data, which is why all of our data is available through THE GRID, our open data portal. This was originally created for Pivot 2020, a Canadian government-backed project which looked at how young were impacted by the pandemic. This involved a very large survey of people aged between 15-29, along with interviews and field research.
As we’ve continued our research, all of this data is now on THE GRID. We have over 419,000 records available across a wide range of topics, from the cost of living in cities to data on employment and resources for healthcare, refugees and education.
To help with adoption we ran video tutorials on how to use the platform and a workshop series called Open Up for youth groups to demonstrate how open data could help them, both in terms of their own operations and for lobbying government bodies.
This education and knowledge can be the missing link when it comes to open data. We’ve tried to bridge this through education and getting more people to use data in their daily lives.
Why did you choose to work with Opendatasoft?
Robert: When it came to technology for our platform we had a choice – we could develop our own or find someone that could meet our needs. We chose to work with Opendatasoft as it was the perfect match for our requirements. It has strong, existing relationships with cities across the world, good technology capabilities, and we have been able to connect with its ecosystem of customers and partners to learn and advance our work. As THE GRID is in English and French Opendatasoft’s multilingual support is crucial to our work.
Genna: As someone without a background in data, I really like how easy it is to create visualizations such as maps within the platform. There’s a really good balance between offering very powerful features, while making them flexible and easy to use out of the box. It is simple to filter data and know that any changes or updates will be applied consistently across tables, maps, and visualizations. We don’t have massive resources, and this really helps us do more with less.
How are you spreading the use of your data?
Genna: We’re committed to democratizing data and that means making it available in a wide variety of formats, shared from THE GRID. For example, we have created a microsite where we use a technique we’ve called “scrollytelling” to tell stories with data, engaging visitors with interactive multimedia experiences around our research. Visitors simply scroll through a story told using data from THE GRID, covering the key themes in an understandable, powerful format.

We’ve also developed data products to make data immediately usable and accessible. We’ve built an app called SettleIn for refugees, providing them with access to all the resources and information they need. The beauty of this is that we leverage the Opendatasoft API to pull relevant data from THE GRID onto the app, ensuring it is always up-to-date and minimizing the work needed to create and maintain it.

What are you currently working on at Youthful Cities?
Genna: We’ve just launched our third Urban Work Index, in partnership with RBC Future Launch. This uses data to show which city in Canada is the best place for young people to work and live. To do this it covers key topics within the ecosystem of work — education and training, affordability, good youth jobs, entrepreneurial spirit, city economy, equity and diversity, sustainability, public health, public transportation, and digital access.
The great thing is that all of the data across the project is fed by THE GRID, our open data portal, ensuring consistency and reducing workload. Visualizations are a key tool in engaging our audience, so the report has maps that visualize key data, such as where young people are moving to. All of these are built in the Opendatasoft platform and then embedded in the report, meaning any updates are automated across THE GRID and report.
It’s also easy for people to drill down into the performance of individual cities and filter around specific themes on THE GRID itself. Given that even lower ranking cities are doing well in certain areas (such as health and education) this provides a complete picture of what is relevant. We can even use the data to create personalized dashboards for each city, and are looking to work with municipalities to help them make the most of the data about their area.
It’s all about using data to drive action and engagement. Opendatasoft is a central part of how we deliver this at Youthful Cities.


