Open Data Use Case: Measuring Crime Rates in Chicago
We attended the ODI Summit a couple of weeks ago, and during a training session, a very interesting dataset was showcased: crime reports in the city of Chicago from 2001 to present.

Throughout all our previous posts, we have introduced many major features of the Opendatasoft platform: APIs, advanced geo mapping, real-time datasets, user engagement…
Today, we would like to come back to the roots of the platform features: the ability to explore large datasets using full-text search, facetted search and data visualizations.
We attended the ODI Summit a couple of weeks ago, and during a training session, a very interesting dataset was showcased: crime reports in the city of Chicago from 2001 to present.
Table View and Facets
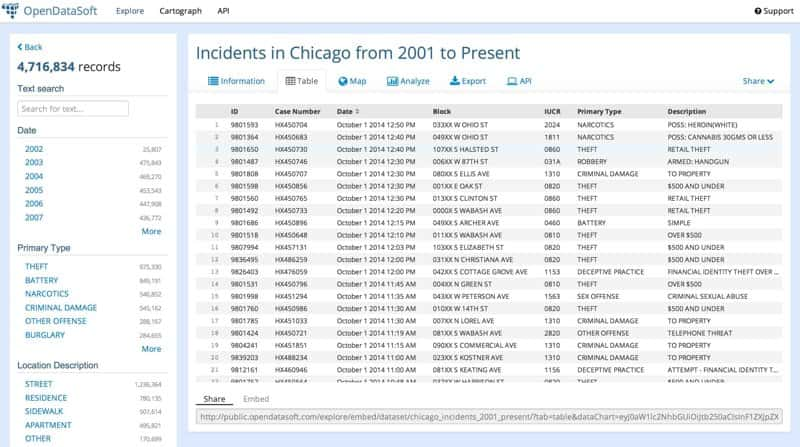
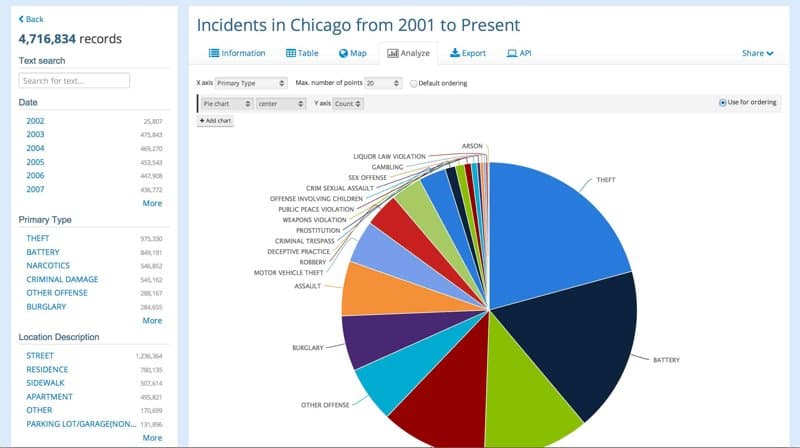
As you can see below, the left column contains a set of filters that you can use to refine your current view. These filters are called facets. The whole set of facets gives a quite interesting summary of the dataset content. For instance we learn that 20% of the reported incidents are “thefts”. Facets can also be used to refine the view to only display records related to a specific facet or set of facets.
Full-Text Search
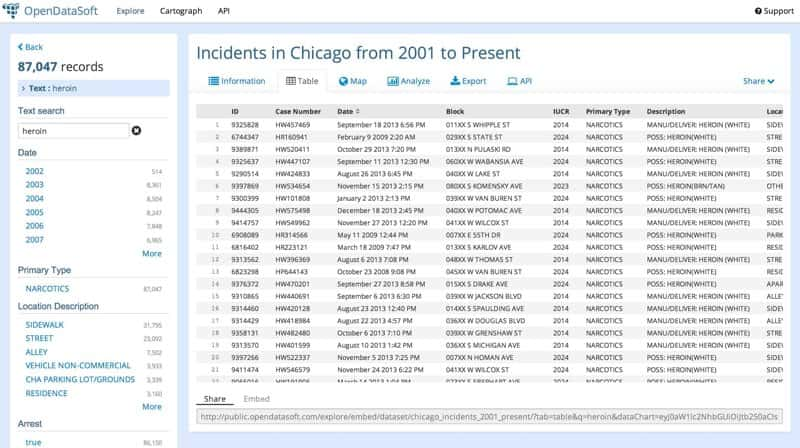
An interesting feature as well is the ability to filter the results with a full-text query. The below states that 87k reported incidents are related to heroin. Of course, query terms can be combined together to build complex queries, mixing both full-text and numerical filters.
Geo Features
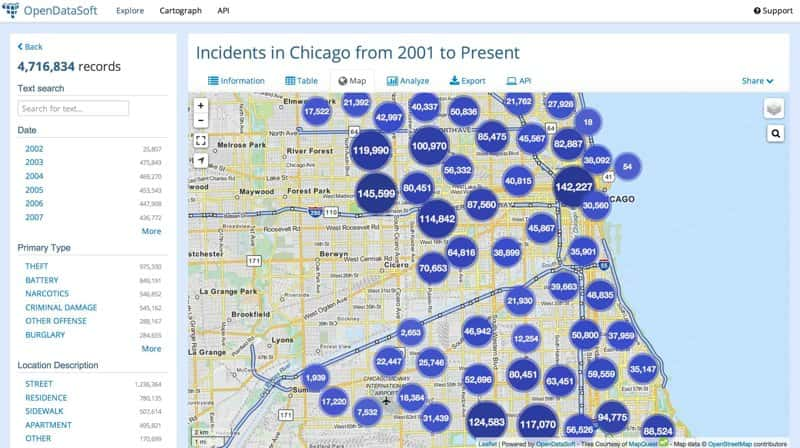
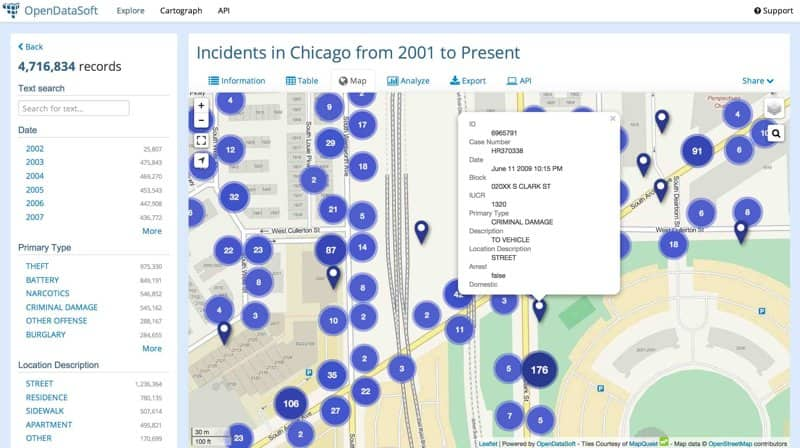
Now, let’s switch to the map view. The first view displays the data geographically clustered. As you zoom in or out or as you move the map, the clusters adapt themselves to map position and zoom level in real time. And at the max zoom level, you have the ability to display detailed data. This view makes it possible to display on a single map and in a very efficient way hundreds of thousands or millions of records.
Analytics
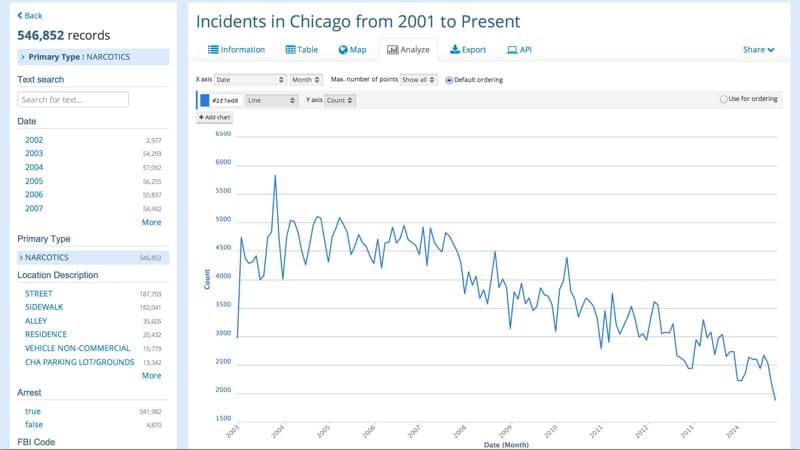
The analysis view makes it possible to quickly build analytics visualizations. These are based on aggregations built on the facets. A wide set of display features are available: bar and stack charts, pie charts, timelines…
Advanced Data Visualizations
And of course you can use our Cartograph and Chart Builder features to build much more advanced data visualizations.
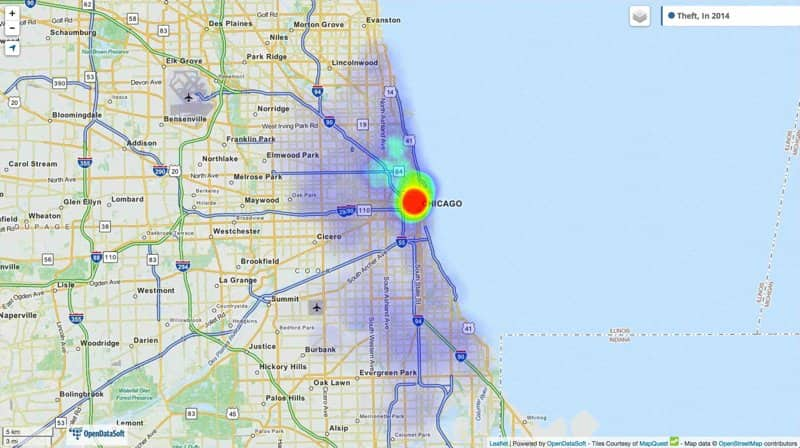
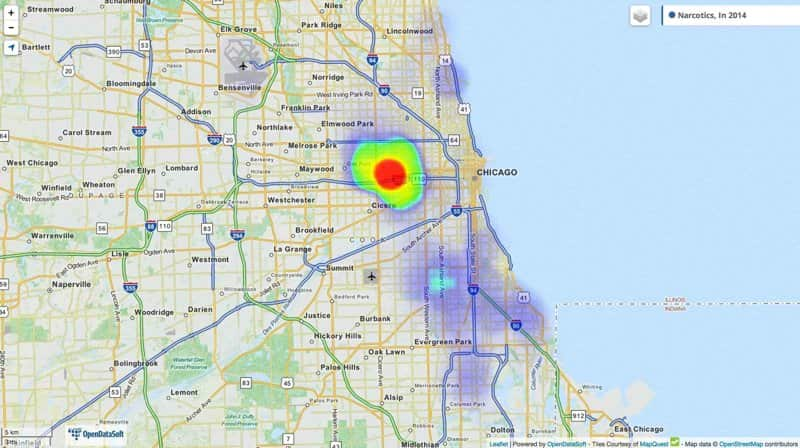
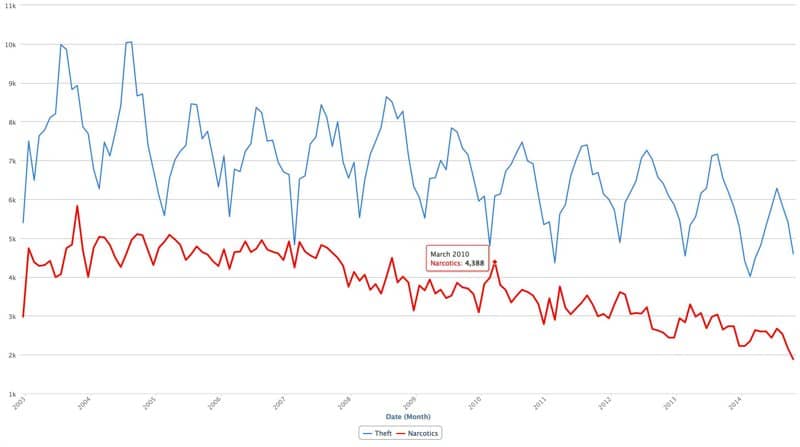
As you can see, all these representations are built with standard features of the platform in a matter of seconds. Open data is often about small datasets but also sometimes about large or very large datasets. And having in such cases simple and scalable features to explore and visualize them is now a must-have for an open data platform.


