Measure the Impact of Your Open Data Portal with Opendatasoft Analytics

In order to support the growing attractiveness of your portal, we've just made new tools available to measure your open data portal's impact and analyze your users' interactions with your data.
The days where you could throw datasets into the wild and hope something positive would happen are over. If you are a city or an administration committed to transparency, or even a company working on developing your relations with your customers and partners, you already have objectives and KPIs to follow. In order to support the growing attractiveness of your portal, we’ve just made new tools available to measure your open data portal’s impact and analyze your users’ interactions with your data.
Imagine, every day, every week or every month being able to answer in just one click:
- Who are the people using your data and to what degree?
- What is the distribution of the popularity among your datasets?
- What are your users looking to do with your data?
Imagine that you could also compare those answers across different periods of time; that you could easily share those answers with the people you work with.
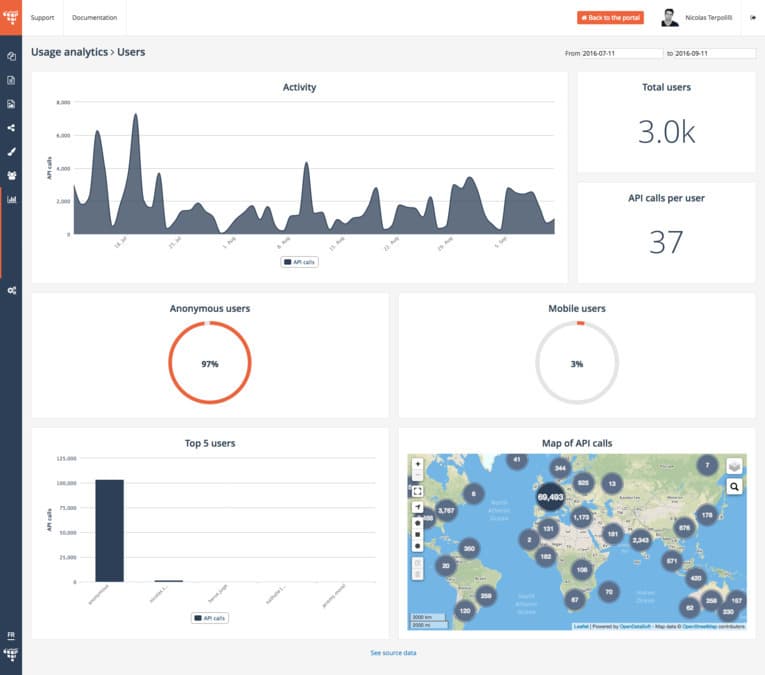
Open data Portal Impact Opendatasoft – Dashboard Users
Opendatasoft Analytics Helps You Measure Your Open Data Portal's Impact
Each of the three dashboards display seven indicators (this is common practice: more than 8 and information becomes hard to remember). There is also always a link to the whole analytics dataset. This allows you to always go back to the original data to make your own charts relevant to your own pre-defined KPIs and other indicators. However, we do believe these new analytics dashboards will bring you some new insights into your data’s impact and will help you leverage your data even better!
Let’s look in detail at three of these indicators. If you want a more exhaustive list of all indicators and how to understand them, please take a look at the complete documentation.
Activity
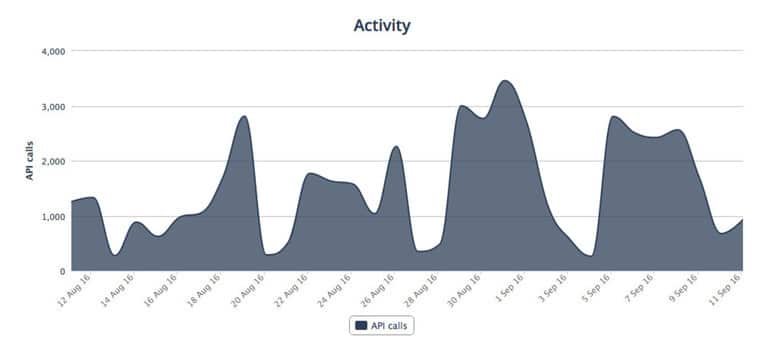
There are several ways to look at the Activity indicator. You can use it to learn about your users. Here, for example, most of the activity happens during the week-days. This probably indicates that your users have a professional purpose for your data. In this case, you can follow this activity indicator to understand your users and their needs to then drive your actions to meet them.
Let’s think of another scenario. Are you running a new communications campaign? Was there an article about your data published or were you on local radio on a given day? You can look at the activity indicator to try and find spikes in activity. This can help you to measure the impact of your communication. The French department (think state/region level) Hauts-de-Seine saw a ten-fold increase in their traffic after the publication of the Archives of the Planet datasets, a collection of photography from around the world . Following your users’ Activity is the first step to understanding the impact of your portal.
Theme Popularity

The theme popularity treemap gives you the distribution of API calls (hence the activity) by theme. This distribution gives you good hints about what kind of data your users are looking for and what’s important to them. This may also signal that certain datasets are much better configured than others.
Furthermore, in most organizations such as a city administration, the metadata matches a corresponding administrative department.
Text Searches with No Result
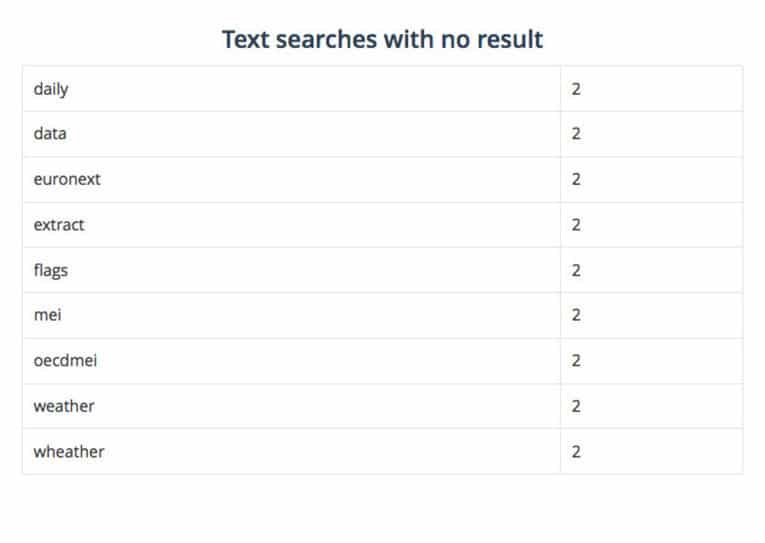
The list of text searches with no result gives you precious information. Either your users can’t find data that are already on your catalog, indicating that you may want to add new tags, or complete the title and description of these datasets; otherwise, they might be searching for data that are not online. In that case, you can use this as an indicator for what datasets to work on next.
That’s exactly what ACTA‘s Data & Services for Agriculture project, API-AGRO, who releases data to the agriculture and farming ecosystem, is doing. They use the text searches with no results to highlight what their users look for and then they try to collect and diffuse the corresponding data.
Two Empirical Observations About Open Data's Impact
It’s not absolutely certain yet, but the more we analyze open data portals, the more it appears that datasets’ popularity and usage follow a Power Law distribution. We’ve already written about it and we are digging more deeply into that question right now. But we do believe that you will already be able to obtain actionable insights. Basically what a Power Law distribution says is that there are a few datasets (1 or 2 for each portal) that see amazing success. Those are the datasets that drive the traffic on the portal and represent the majority of data usage. It also says that there is a long tail of datasets not “incredibly successful” but still interesting to a lot of people. In the same way Amazon has two different strategies for its most popular products and for the long tail, you can imagine planning different workflows, different communication tactics and different marketing approaches for your really popular datasets and for the long tail of less popular yet really impactful datasets.
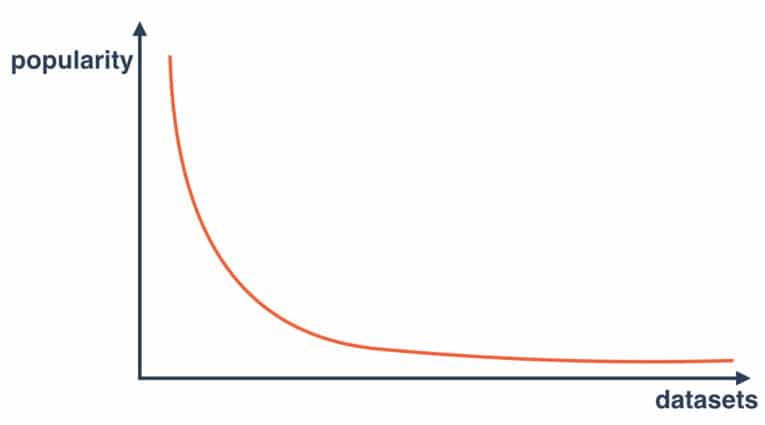
Open data Portal Impact – Power Law distribution of datasets’ popularity
Keep in mind that when we talk about this 80-20 distribution, it also means that 1% of your datasets may represent 50% of your portal’s traffic and data usage. This surely is a major insight!
There is another very empirical rule that keeps popping up when we analyze open data portals impact: the data usage almost all the time falls exclusively in one of the following three categories: Geographic use, Analysis or Search. To demonstrate this, take a look at the chart below. We use our public portal to make datasets available that have already been opened simply through federating them. The datasets in the catalog may be very diverse.
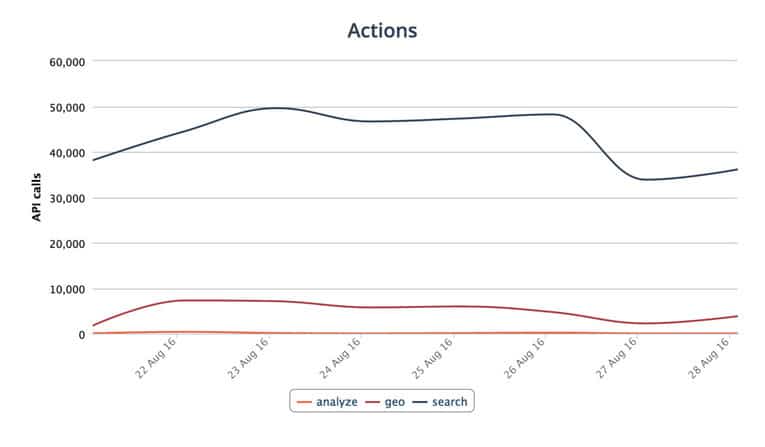
As you can see, Search is by far the main usage of the portal. That’s what we expected because that portal aims to help our users discover useful data. But if you use your portal to create dashboards or if you work a lot with geographical data it should be different. And if you haven’t really thought about it yet, it could be a good start to understand what your users are doing on your portal and how you can make it work to improve the ROI of your open data portal.
Thus, we are working on defining an open data popularity score. It’s hard to deal with both the number of downloads and the number of API calls and their dynamics over time. It’s also hard to compare two data portals or two different sectors’ data usage. Being part of Opendatasoft’s network is not only having access to every open dataset without having to download and re-index it. It’s also a way for us to share with you the knowledge we can build.
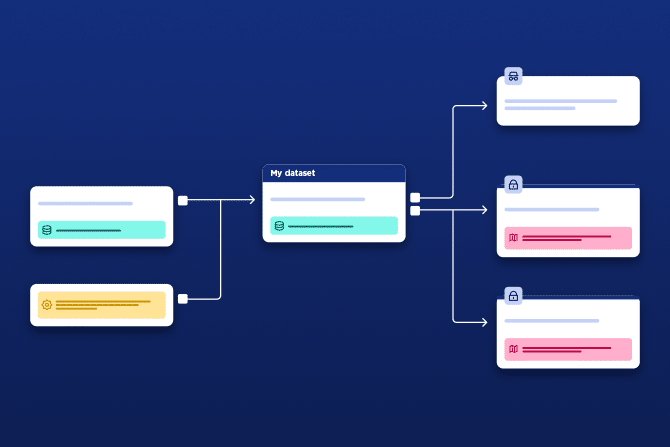
Opendatasoft has launched its unique, innovative data lineage feature. Focused on usage, it allows organizations to better understand how their data is used internally and externally, across data ecosystems, while improving the ease and efficiency of data portal management.

Data portals need to demonstrate their impact and meet user needs by providing the right data assets to generate reuse. We explore how our customers are using the Opendatasoft data lineage feature to analyze portal performance and continually improve the experience they provide.

