Open Data Day 2022 – demonstrating the power of open data

March 5 marks Open Data Day 2022. As part of the celebrations we're highlighting the impact of open data and how data democratization is developing across the world through key use cases.
We’re approaching the 12th annual Open Data Day, happening this year on Saturday 5th March. It will see a range of events and hackathons taking place around the world, in countries from Japan and the US to Colombia and Tanzania. All of these aim to help drive ever greater transparency and data democratization around public services.
Since the first Open Data Day, proposed by David Eaves, then Advisor to the Mayor of Vancouver on Government Policing in 2010, the whole field of open data has expanded massively. A combination of digitization, regulation and a desire by governments to be more open and transparent have all contributed to democratize data and make it available and understandable to all. Over time businesses have begun to see the benefits of an open data approach, with companies in sectors as diverse as banking, telecoms and energy all putting in place their own initiatives.
To celebrate Open Data Day 2022 we’ve brought together a selection of exciting projects from our customers to help illustrate the benefits it delivers. These are organized around three broad themes:
- Building sustainable cities
- Strengthening trust with citizens
- Creating an ecosystem around data
Building Sustainable Cities
1- Track trees planted across Long Beach
The Californian city of Long Beach is investing heavily in creating islands of green space, with an active urban forest development program. This aims to combat climate change and offset greenhouse gas emissions.
Through a dashboard accessed via its open data portal residents can now see the exact location of every tree planted since 2018, as well as its species and rates of planting.
2- Analyze multimodal travel in Paris
In Paris, thermal cameras with pattern recognition have been installed at eight sites to record bikes, scooters and motorized vehicles (cars, trucks, buses and motorbikes) as they pass. The real-time Internet of Things (IoT) data from these sensors is published on the municipality’s open data portal, which has also used Opendatasoft’s data visualization features to create dynamic analysis reports.
Internally this helps improve traffic management, relieve congestion, prevent accidents and reduce air pollution. Externally, it is used by a range of organizations, from cycling clubs to public transport operators and citizens, and can be easily cross-referenced with other datasets including overall traffic, air pollution and weather.
3- Understand the breath of the city in Bologna
The Italian city of Bologna believes that the movement of people through its streets is similar to the breath in the human body. Through its Il respiro di Bologna (the breath of Bologna) data story, the city shows different points of social and cultural interest on its map, including travel times between them and available mobility services.
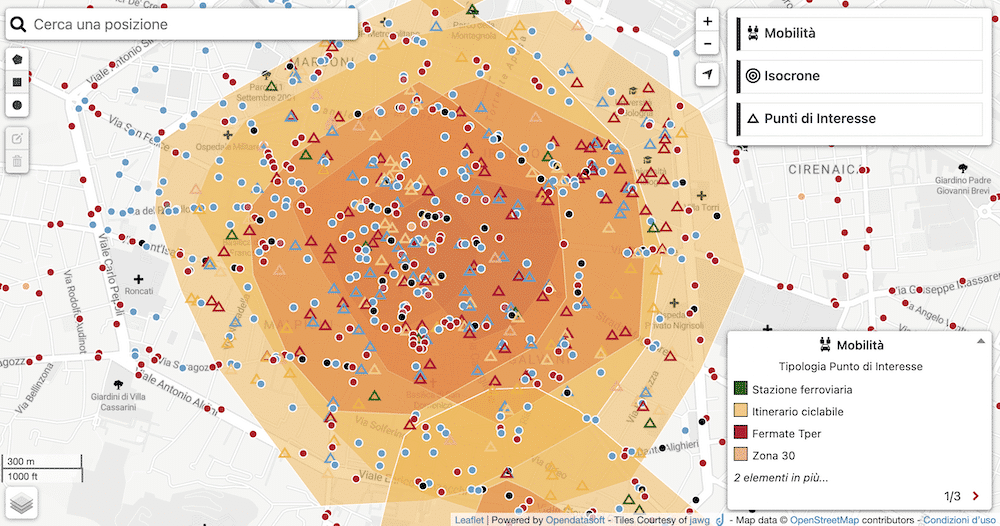
Shared through open data, these data visualizations update and inform residents and tourists about the city, while providing the authorities with key information on mobility that can be used to improve the quality of life across Bologna.
Strengthening trust with citizens
4- Demonstrate service level quality in Vancouver
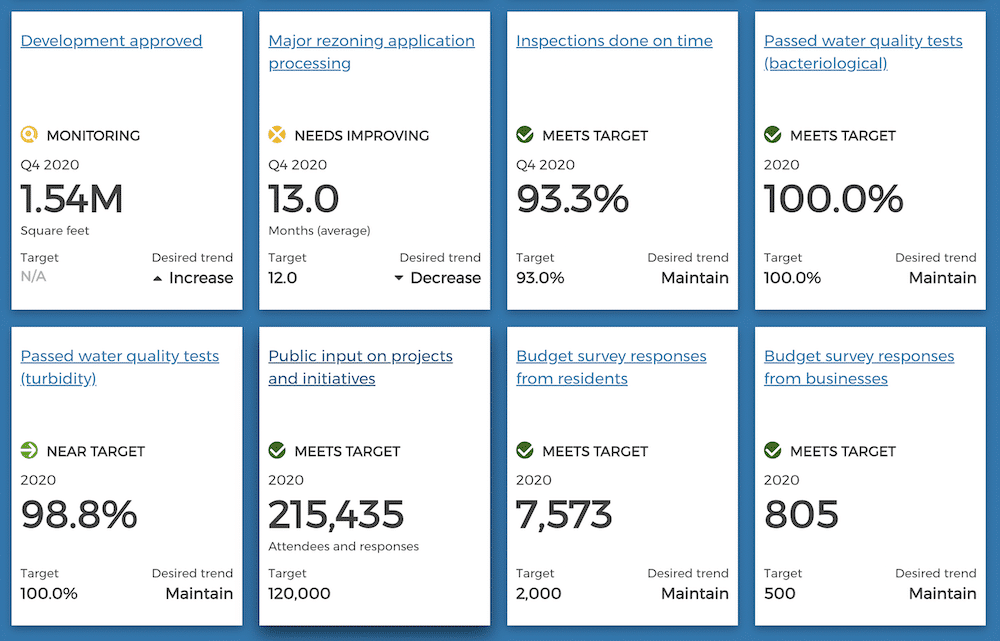
Open data enables cities and public sector institutions to be more transparent and accountable to their citizens, showing performance against targets. Vancouver in Canada achieves this through its VanDashboard.
The city has built 65 indicators to measure and enhance the performance of its activities around six key themes:
- Provision of essential services
- Access to housing
- Climate change
- The economy and finance
- Equity and social issues
- Cultural dynamism
The dashboard for each indicator shows whether the objective has been achieved, is close to being reached or not yet delivered, as well as giving details of the metric itself. Detailed examples include response times to fire call outs, or the share of renewable energies in the city’s energy mix.
5 – Sharing air quality data in Bristol
The city of Bristol in the UK is a pioneer in delivering innovative solutions for better public services. It therefore wanted its open data portal to help increase transparency and empower citizens with the information they need.
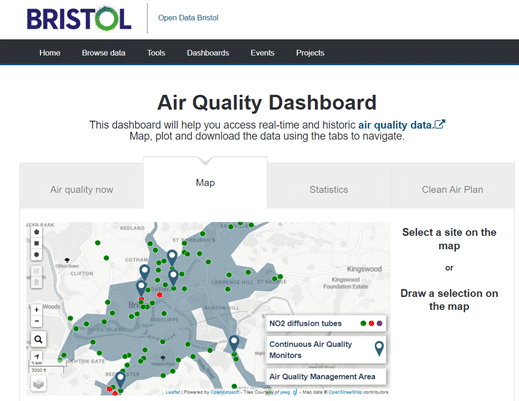
One area it is focusing heavily on is sharing information on air quality across the city. Through an open data dashboard it is displaying the results of real-time air quality monitoring, visualizing the levels of pollutants across different parts of the city. This helps explain the council’s policies, such as around restricting traffic in specific areas, in a clear, transparent way.
6 – Reaching all citizens in Salinas
The City of Salinas in California wanted to give all residents greater insight into how government decisions were made as well as making data available to all, internally and externally. This underpins its push to become a smart city, using data to improve everyone’s daily lives.
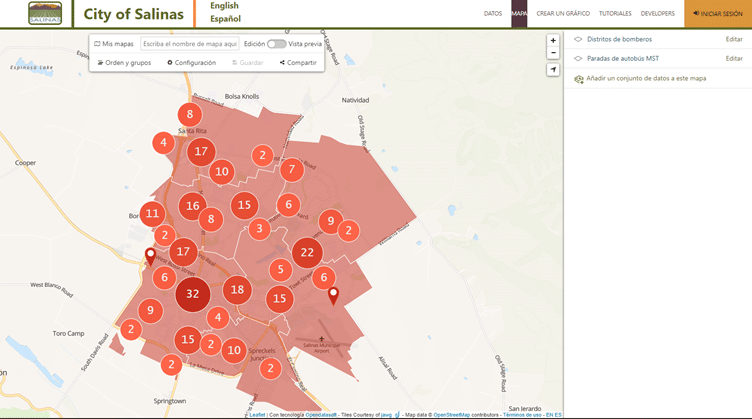
Given its demographic mix Salinas’ open data portal needed to be accessible to both English and Spanish-speaking audiences. Users can simply switch between the two languages, with the fully multilingual portal providing exactly the same data, visualizations and experience to all.
7 – Telling stories with data in the town of Cary
The largest town in North Carolina, Cary aims to use data to connect its communities and increase transparency. Users of its open data portal can download datasets, create maps and data experiences, and even suggest new data sources to add.
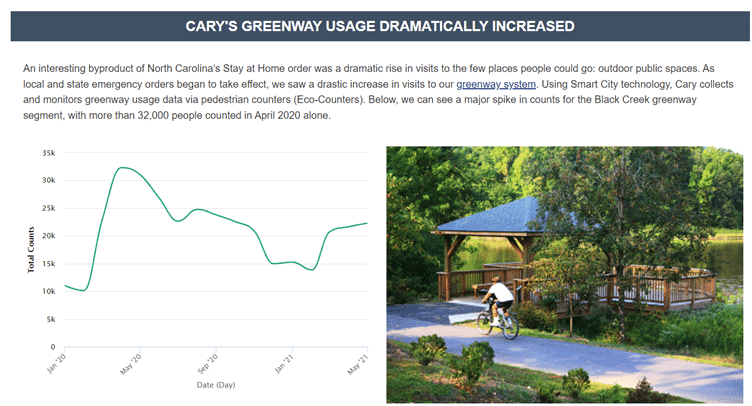
To help further extend the use of data, Cary creates a range of data stories on specific topics, using information to inform and explain. These range from stories on the town’s trails and greenways, to the impact of the opioid crisis. All of these aim to bring data to life for users, whatever their interests and technical skills.
Creating an ecosystem around data
8 – Delivering a one-stop shop for information on North Carolina
Log Into North Carolina (LINC) provides comprehensive economic and demographic data about the US state, covering topics as varied as population, labor force, energy and agriculture – all via one portal.
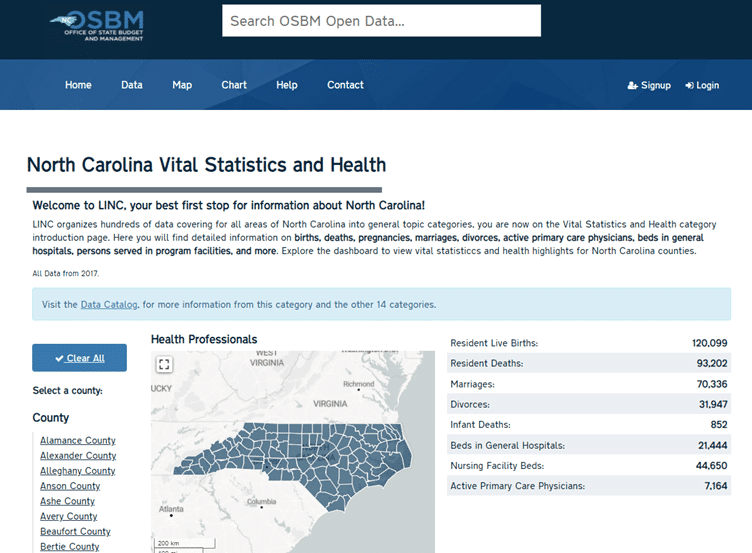
LINC aims to meet the needs of diverse stakeholders – from children learning about their state for school projects and those looking to move to North Carolina, through government employees to academic researchers. It helps support greater transparency and more informed decision-making by providing access to up-to-date, comprehensive information.
Data is available in multiple ways – through an easy-to-use interface, via APIs and as data stories and visualizations. To further increase usage the North Carolina Office of State Budget and Management (OSBM), which runs LINC, carries out regular roadshows and webinars aimed at specific members of the community, from state departments to municipalities.
9 – Building a diverse data community with UK Power Networks
UK Power Networks (UKPN) is the UK’s largest distribution network and system operator, responsible for power distribution to 8.3 million homes and businesses. As the energy sector decarbonizes, sharing data is essential to delivering innovation, collaboration, digitization and resilience.
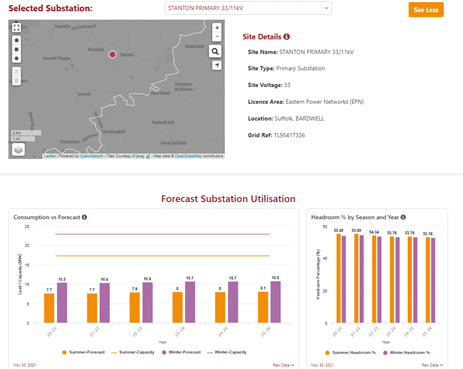
When building its new open data portal, UKPN therefore spent time understanding its stakeholders (who range from local government to businesses and consumers). It ran multiple events to learn about their needs and involved them in testing the beta version of the portal. The result is an active, ongoing open data community, used by over 5,000 people to access UKPN’s data in multiple ways.
10 – Democratizing data for all in Jersey City
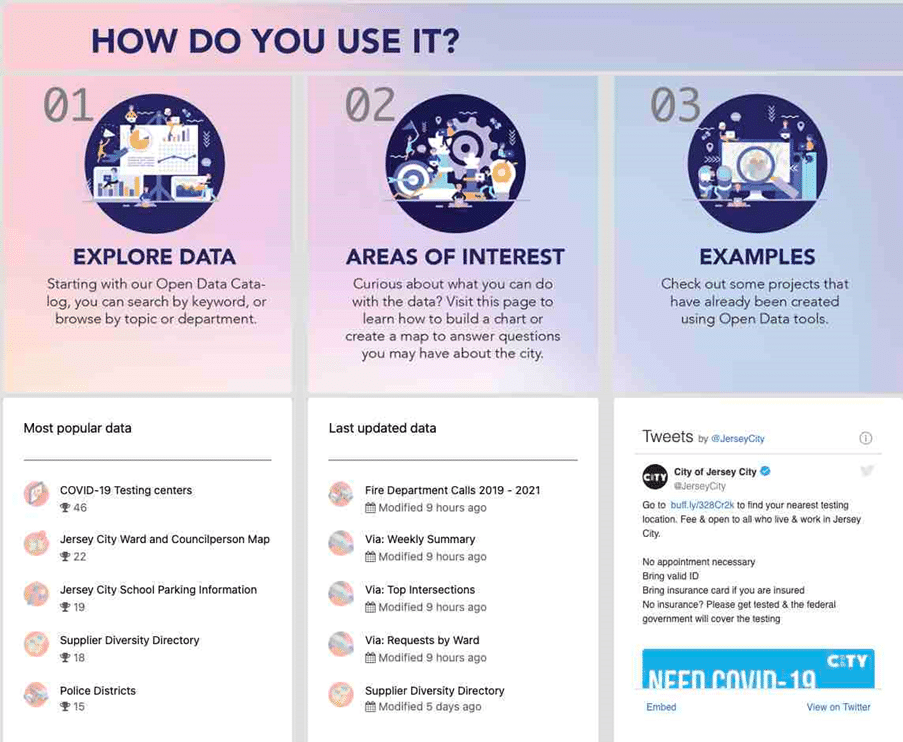
Jersey City is the United States understands the importance of sharing data with its over 247,000 residents and helping them to use it to improve their experience. To achieve this the City’s teams now publish multiple open data portals providing a wide variety of visualizations, including for:
- Locating bicycle facilities
- Finding street art
- Identifying the location of COVID testing centers
- Getting information on firefighting activities
- Finding information about suppliers employed by Jersey City
A clear, intuitive interface and step by step explanations aim to make data accessible and usable by everyone, creating a community built on data.
 Data Trends
How successful are governments at sharing their data with citizens and businesses? The latest Open Data Maturity report provides an overview of progress across Europe, and highlights the importance of improving data portals and measuring impact to future success

Data drives effective, well-functioning smart cities and helps build local ecosystems that bring together all stakeholders to meet the needs of the entire community. However, sharing data between stakeholders can be difficult - based on recent Gartner research we explain how urban data exchanges transform smart city data sharing.

