Putting Data to Work: Challenges and Perspectives
How are organizations currently using - and benefiting from - their data? We interviewed over 200 decision-makers from all sectors to get an in-depth picture of data use as we move into 2022.

Data is at the heart of today’s digital economy – it underpins our lives and how businesses and society operate. Organizations produce and store huge volumes of data and it is increasingly recognized as a resource that is vital for successful operations and activities.
To understand how organizations are currently using data (including their strategies, the technologies they are using, their maturity levels, benefits, obstacles, and future plans), we interviewed more than 200 decision-makers from large organizations in all business sectors last October.
The aim was to look behind the headlines. For example, although 84% of respondents see the impact of data projects as positive for their organization (and 25% rate it as very positive), how mature are they actually? And what are the challenges to be tackled in order to move forward, scale, and access all the benefits of data democratization?
SEE THE INFOGRAPHIC
In this article, we take an in-depth look at the results of our study, which we carried out with L’Usine Digitale.
Organizations recognize the importance of data
Almost 9 out of 10 respondents see using data as important to their organization, with the majority (51%) ranking it as very important. Nearly three-quarters (74%) report that data plays a key role in the decision-making process.
And the pandemic has only intensified this trend. For 49% of those questioned, the upheavals linked to COVID-19 impacted their organization’s strategy and accelerated the deployment of data projects.
A range of key benefits
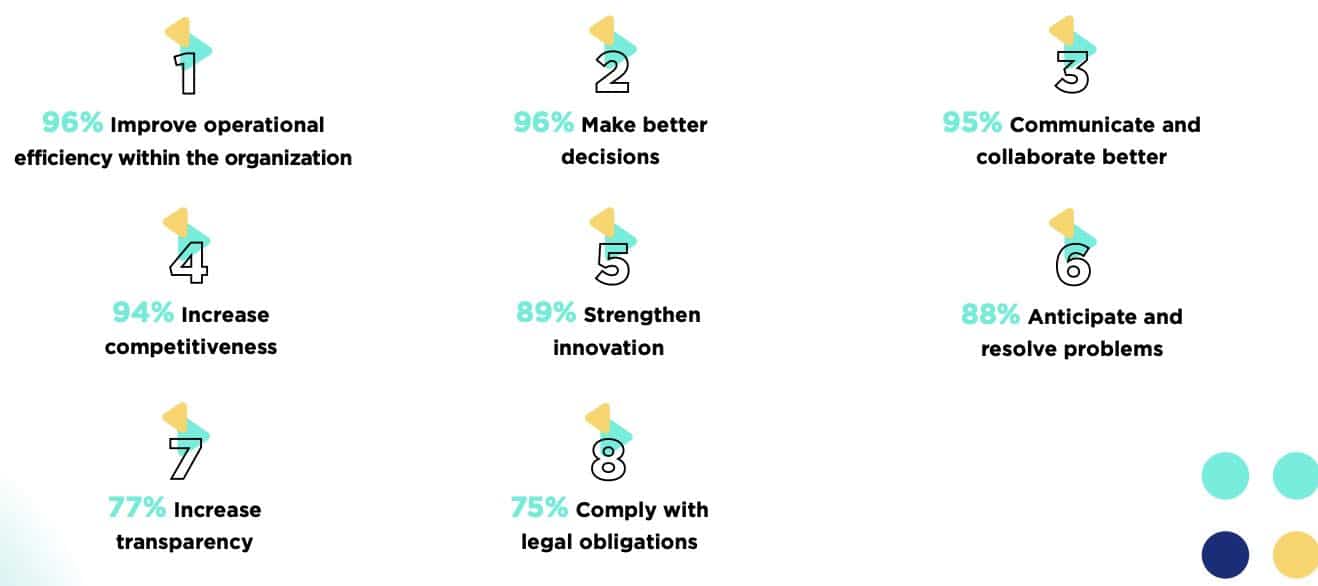
The decision-makers we surveyed highlighted multiple benefits from setting up a data project:

Looking at the gap between aims and reality
In practice however the data projects that are actually carried out meet less structured, more tactical objectives. 80% of respondents said that their projects are linked to legal obligations requiring them to publish their data. In reality projects actually deliver on these objectives:

There’s a 20 point difference between respondents who hope to improve internal operational efficiency and those who actually achieve it. The same difference exists between those who want to use data to anticipate and solve problems and those who actually see the benefits of doing so.
How can this difference between reality and objectives be explained?
Looking further into the data, our study uncovers lessons on how to structure and organize projects, as well as highlighting challenges that must be overcome in order to deliver scale and reap the full benefits of data sharing and usage.
Assessing organizational maturity when it comes to data projects
Only 50% of respondents report that their organization is currently making use of data. A quarter of respondents plan to do so in the future.
Amongst those who have already implemented data projects, the level of experience varies. Almost half say they have been active for less than four years, and half report over four years of running data projects.
How mature are they when it comes to data? Just 41% say that their projects have already been launched. Meanwhile, 54% report that their organization is at an earlier stage, whether design (32%), running feasibility studies (12%), or inventory and diagnosis (10%).
How are data projects organized internally?

To carry out their data projects, organizations normally create either a centralized structure or a cross-functional team.
We found that respondents who have not yet launched data projects are more likely to pick a centralized structure. This allows organizations that are just getting started to centralize knowledge and involves fewer resources than if they were to set up cross-functional teams.
On the other hand, organizations already involved in data projects are mainly organized in cross-functional teams, with experts integrated into each team. The benefits of doing this are better communication, alignment with a single global data strategy, and the sharing of internally acquired knowledge.
The presence of cross-functional teams also facilitates the development of an internal data culture and puts data to use more quickly, making it available to employees, partners, customers, and users.
Which data is being used?
Organizations report that they rely on an average of just three types of data.
Customer data (50%), external socio-economic/public data (49%), commercial (49%) and financial (47%) data are most used on a daily basis. Next comes business data from other departments (40%), market data (32%), and user data (12%).
In the most structured organizations, this information may be accessible to all employees via a dashboard that groups together the most important indicators and insights obtained. Experience shows that this delivers substantial benefits in internal collaboration. For example, SNCF Reseau estimates that it is achieving an ROI of €10 million per year thanks to its “VIP DATA” portal, which is accessible to 57,000 employees and brings together 280,000 pieces of metadata, driven by the participation of all employees.
How are the results of data projects measured?
When it comes to measuring success, the most popular indicator is the number of people who consult the data that is made available (42%). This reinforces that the need for data transparency and openness is a priority among respondents.
Other metrics include:
- Customer feedback on services and products (39%)
- Organizational reputation (35%)
- Revenues (27%)
- Sales (25%)
- Feedback from people within the organization (27%)
These findings reflect the main challenges facing organizations involved in data projects: improved internal collaboration around data; the need for transparency; and a desire to improve products and services to create additional revenues.
What are the challenges?
Only 30% of decision-makers indicate that their data projects can be deployed in less than six months.
For 53%, it takes more than six months for their projects to be launched, and 23% require over a year.
Why do data projects take so long to deploy? What challenges do organizations have to overcome in order to use data sustainably?
The lack of data management resources
For 43% of respondents, their organization lacks sufficient internal resources to run a data democratization strategy, and 87% say they need to increase or maintain the resources at their disposal..
In addition, 51% say that the lack of internal data management resources is a real obstacle in developing their data projects.
Solutions that are accessible only to experts
Data remains a technical topic dominated by experts (such as data scientists and data analysts). Showing this, 62% of decision-makers say their organizations have invested in storage tools, such as data lakes, data management platforms, and data cataloging tools. 57% also say they have a business intelligence (BI) solution.
However, only 52% have data access and sharing tools that would allow all teams to use data in their day-to-day operations and that make it available to all stakeholders.
In addition, 40% of those questioned complain about the complexity of data management tools. This shows that too few organizations have solutions in place that are truly adapted to their needs and are accessible to all employees.
Difficulties in sharing a data culture internally
For 56% of decision-makers, their lack of a data culture is an obstacle to carrying out their projects.
This is certainly the most difficult aspect to implement since it requires effort from the entire organization to change how people work, collaborate, and think.
A lack of knowledge about their tools (mentioned by 39% of respondents) and the teams’ lack of training on how to use them (34%) show that getting wider involvement is a project in its own right, and one that should not be neglected when looking to implement data experiences.
Obstacles at all stages of data use
Asked about the main difficulties they encountered when making use of data, 61% of respondents emphasized the problem of data quality and reliability, 48% cited the ability to access and centralize their data, and 30% mentioned the ability to share data.
Nearly two-thirds of respondents said that it is hard to find good quality data. Meanwhile, 7 out of 10 believe that they can easily present and share their data once they have successfully accessed and centralized it.
In addition, 33% of the decision-makers we surveyed report that the lack of data governance in their organization is an obstacle in the development of their data projects.
Overall, this in-depth study shows that decision-makers are focused on data projects and aware of the benefits for their organization.
However, they are concerned that they lack sufficient resources to deploy the right tools and train employees. Both of these areas are essential for scaling up and taking full advantage of all the value creation potential of projects involving the democratization of data access and use. Essentially this means that currently many are held back from unleashing the full power of their data, inside and outside the organization.


